Storm Surge
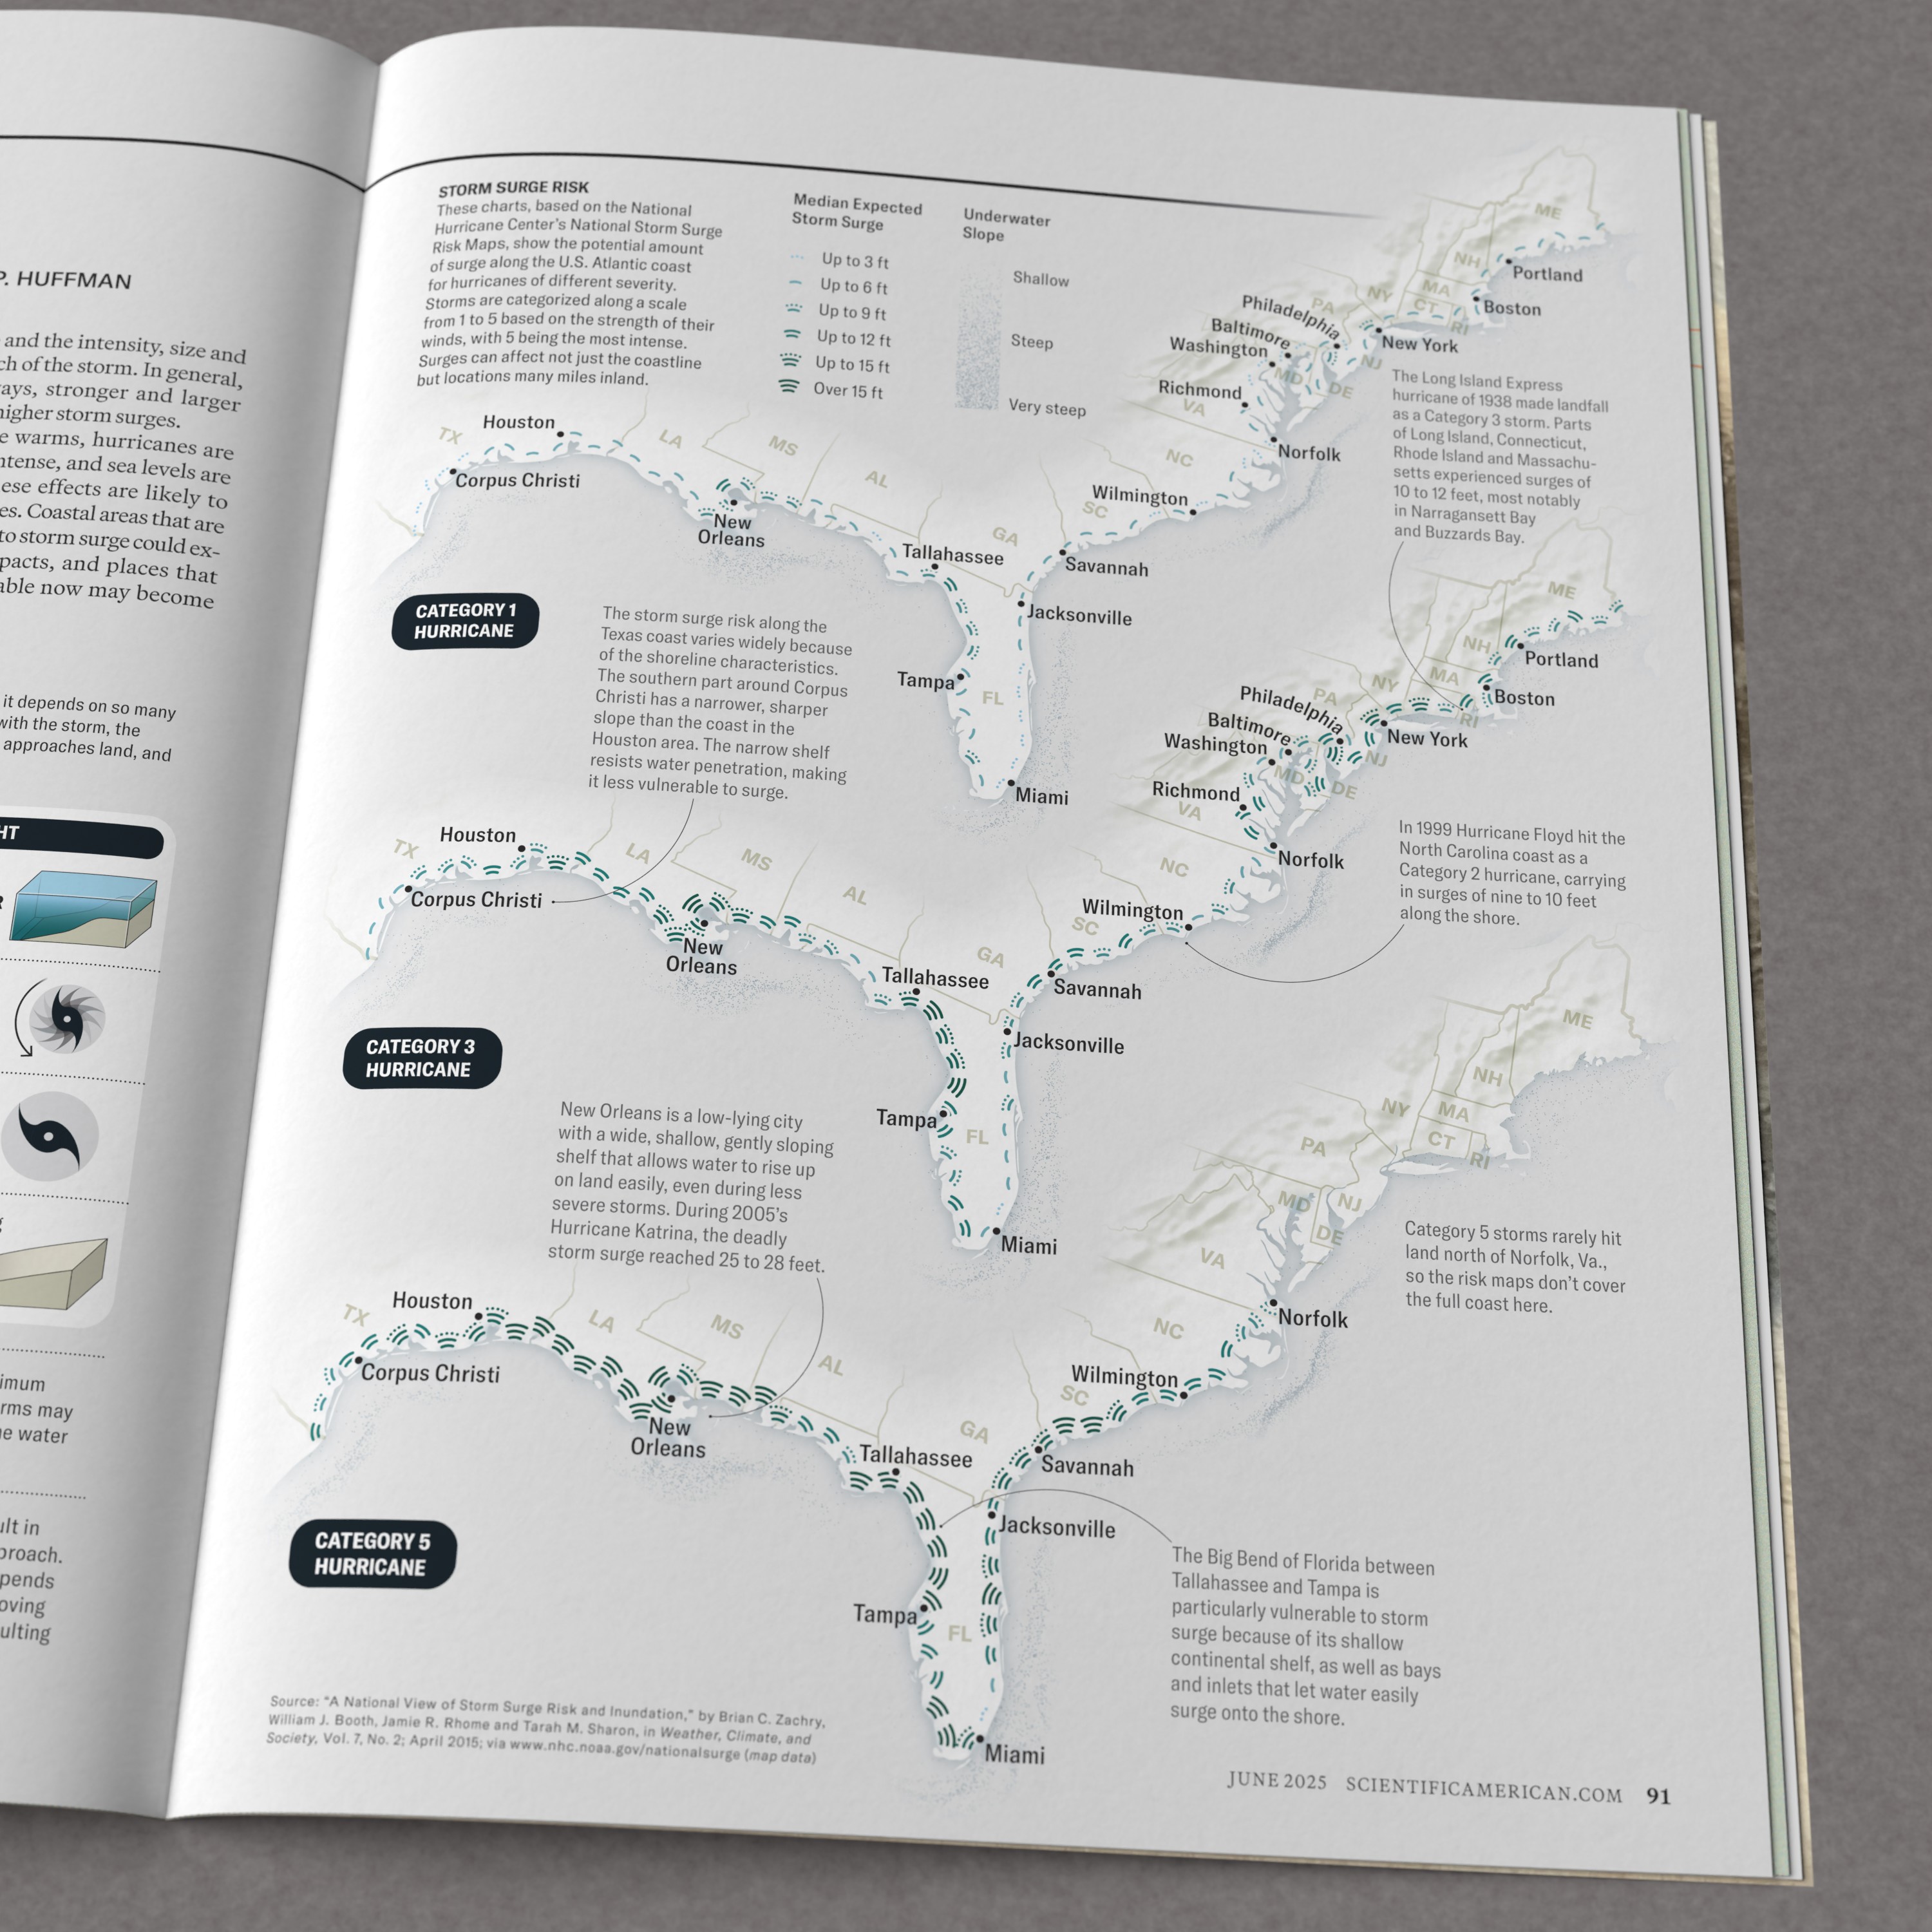
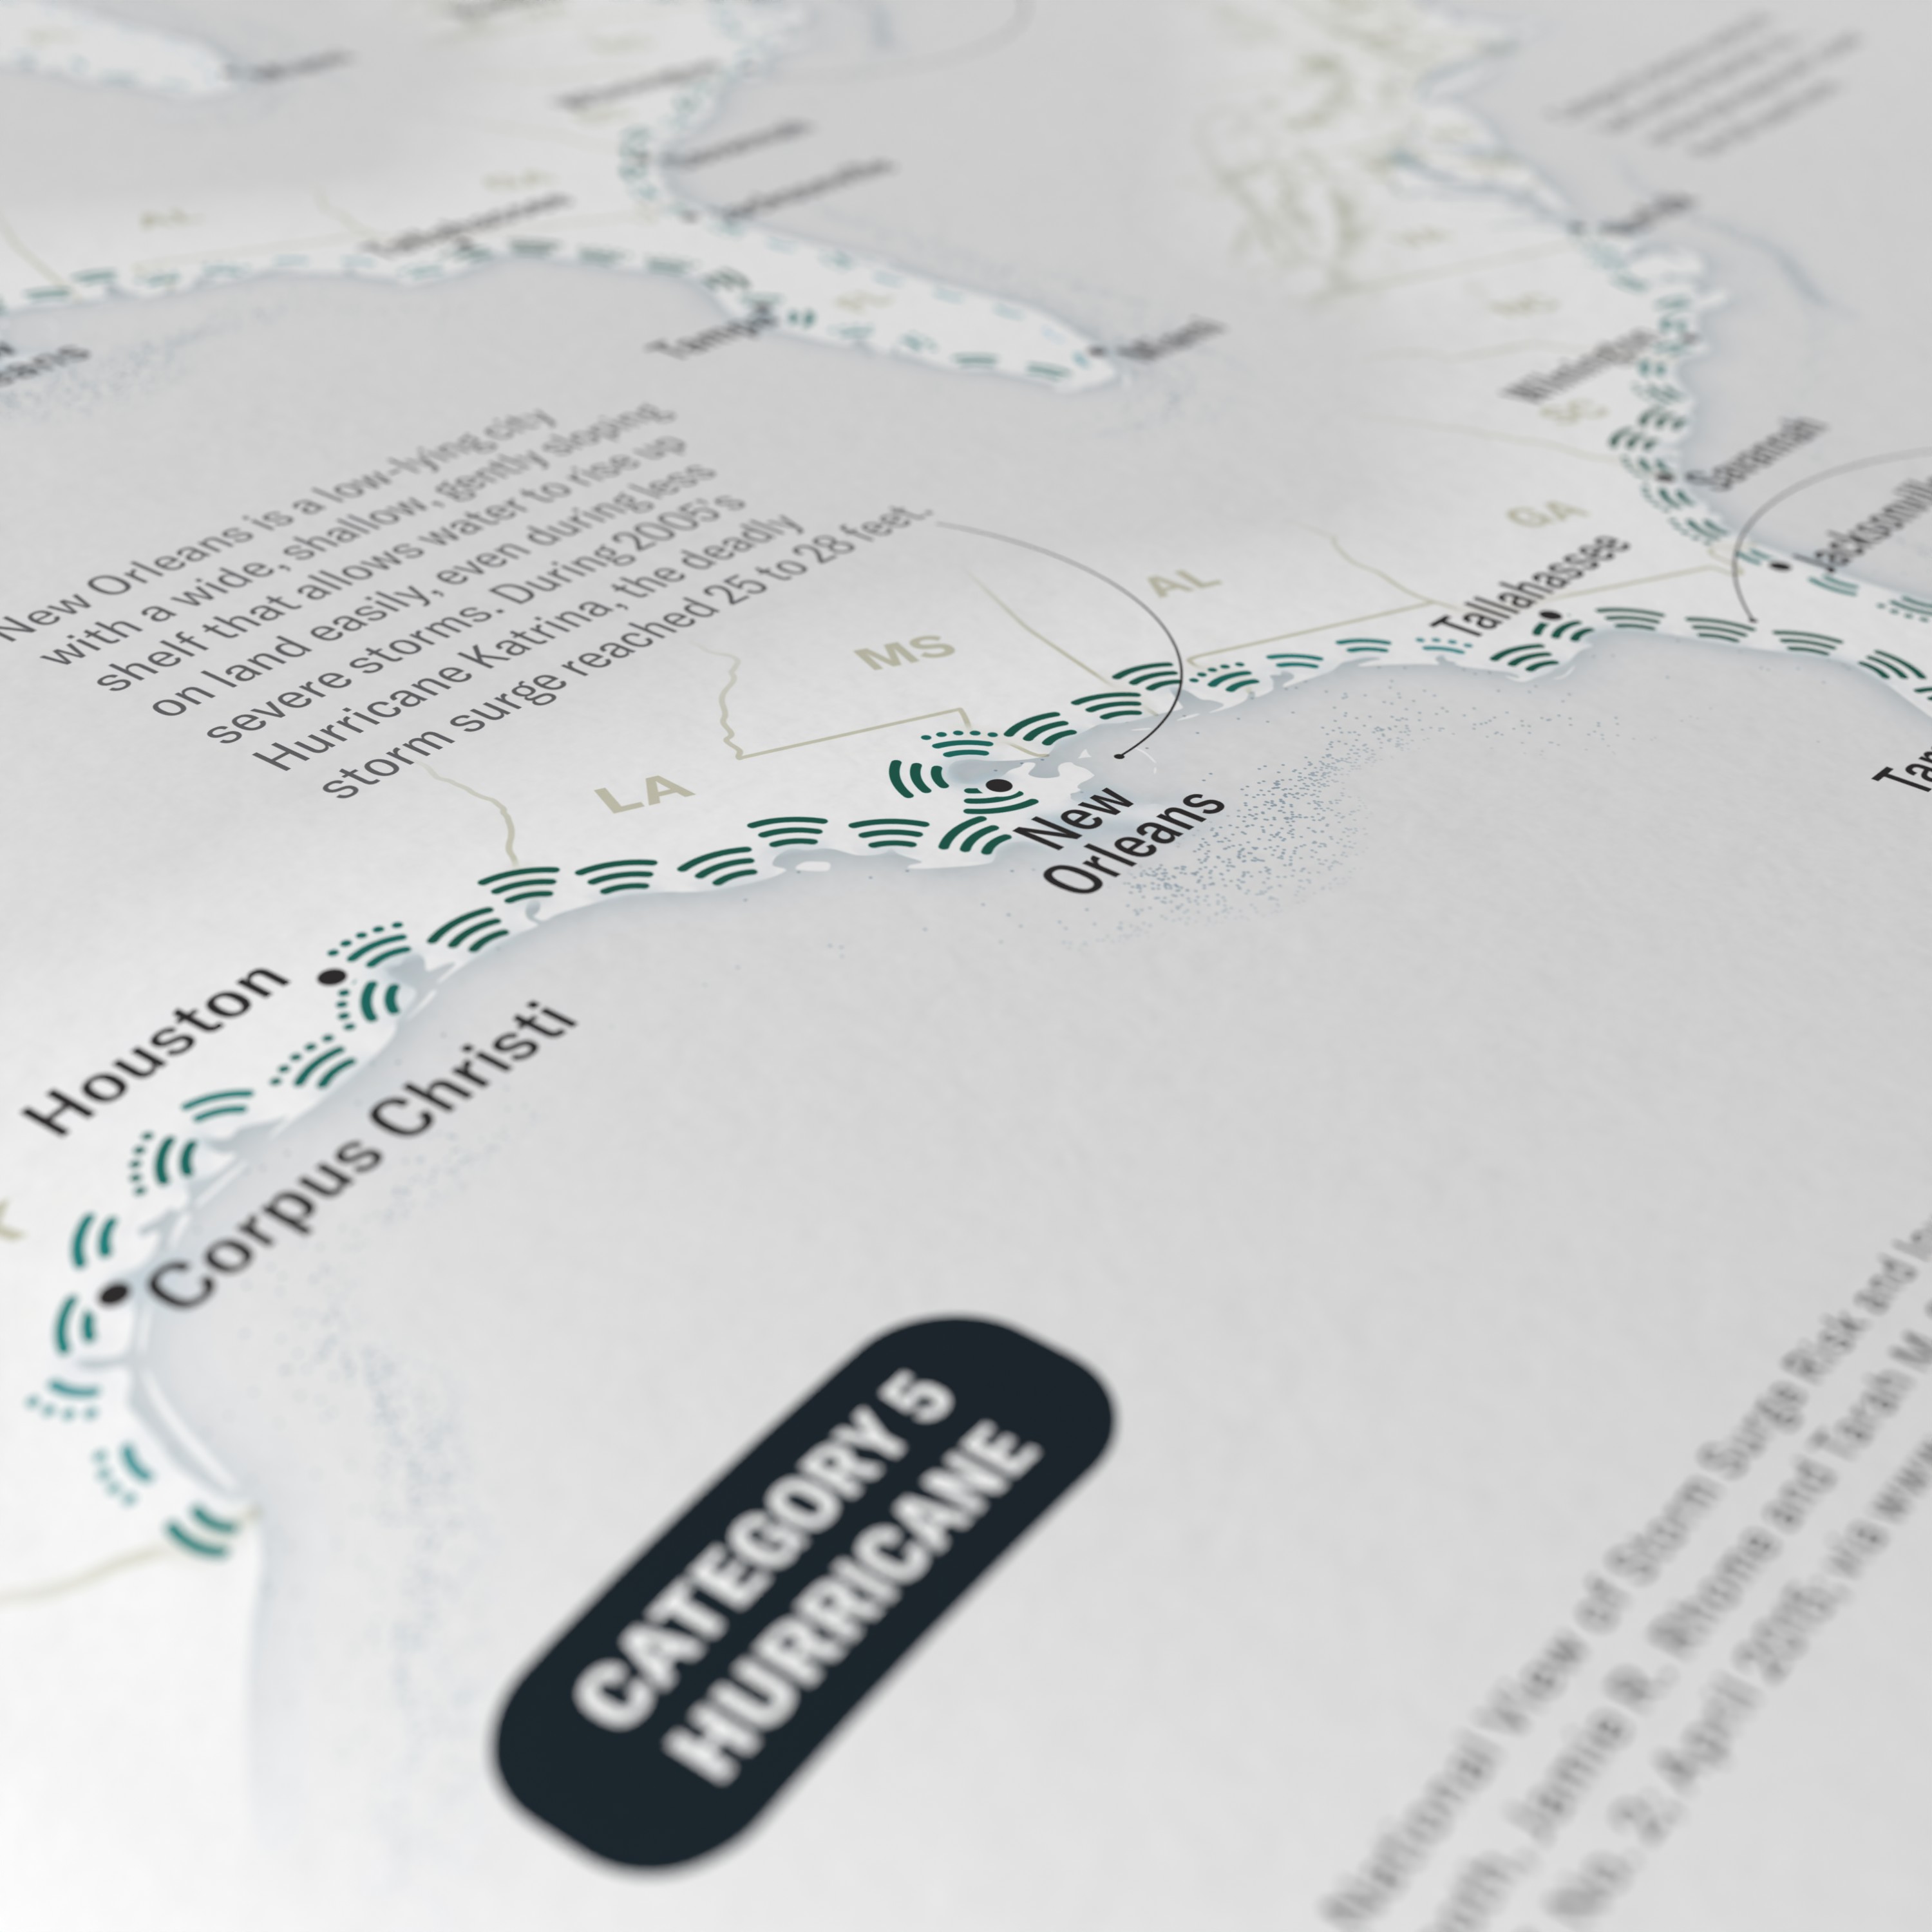
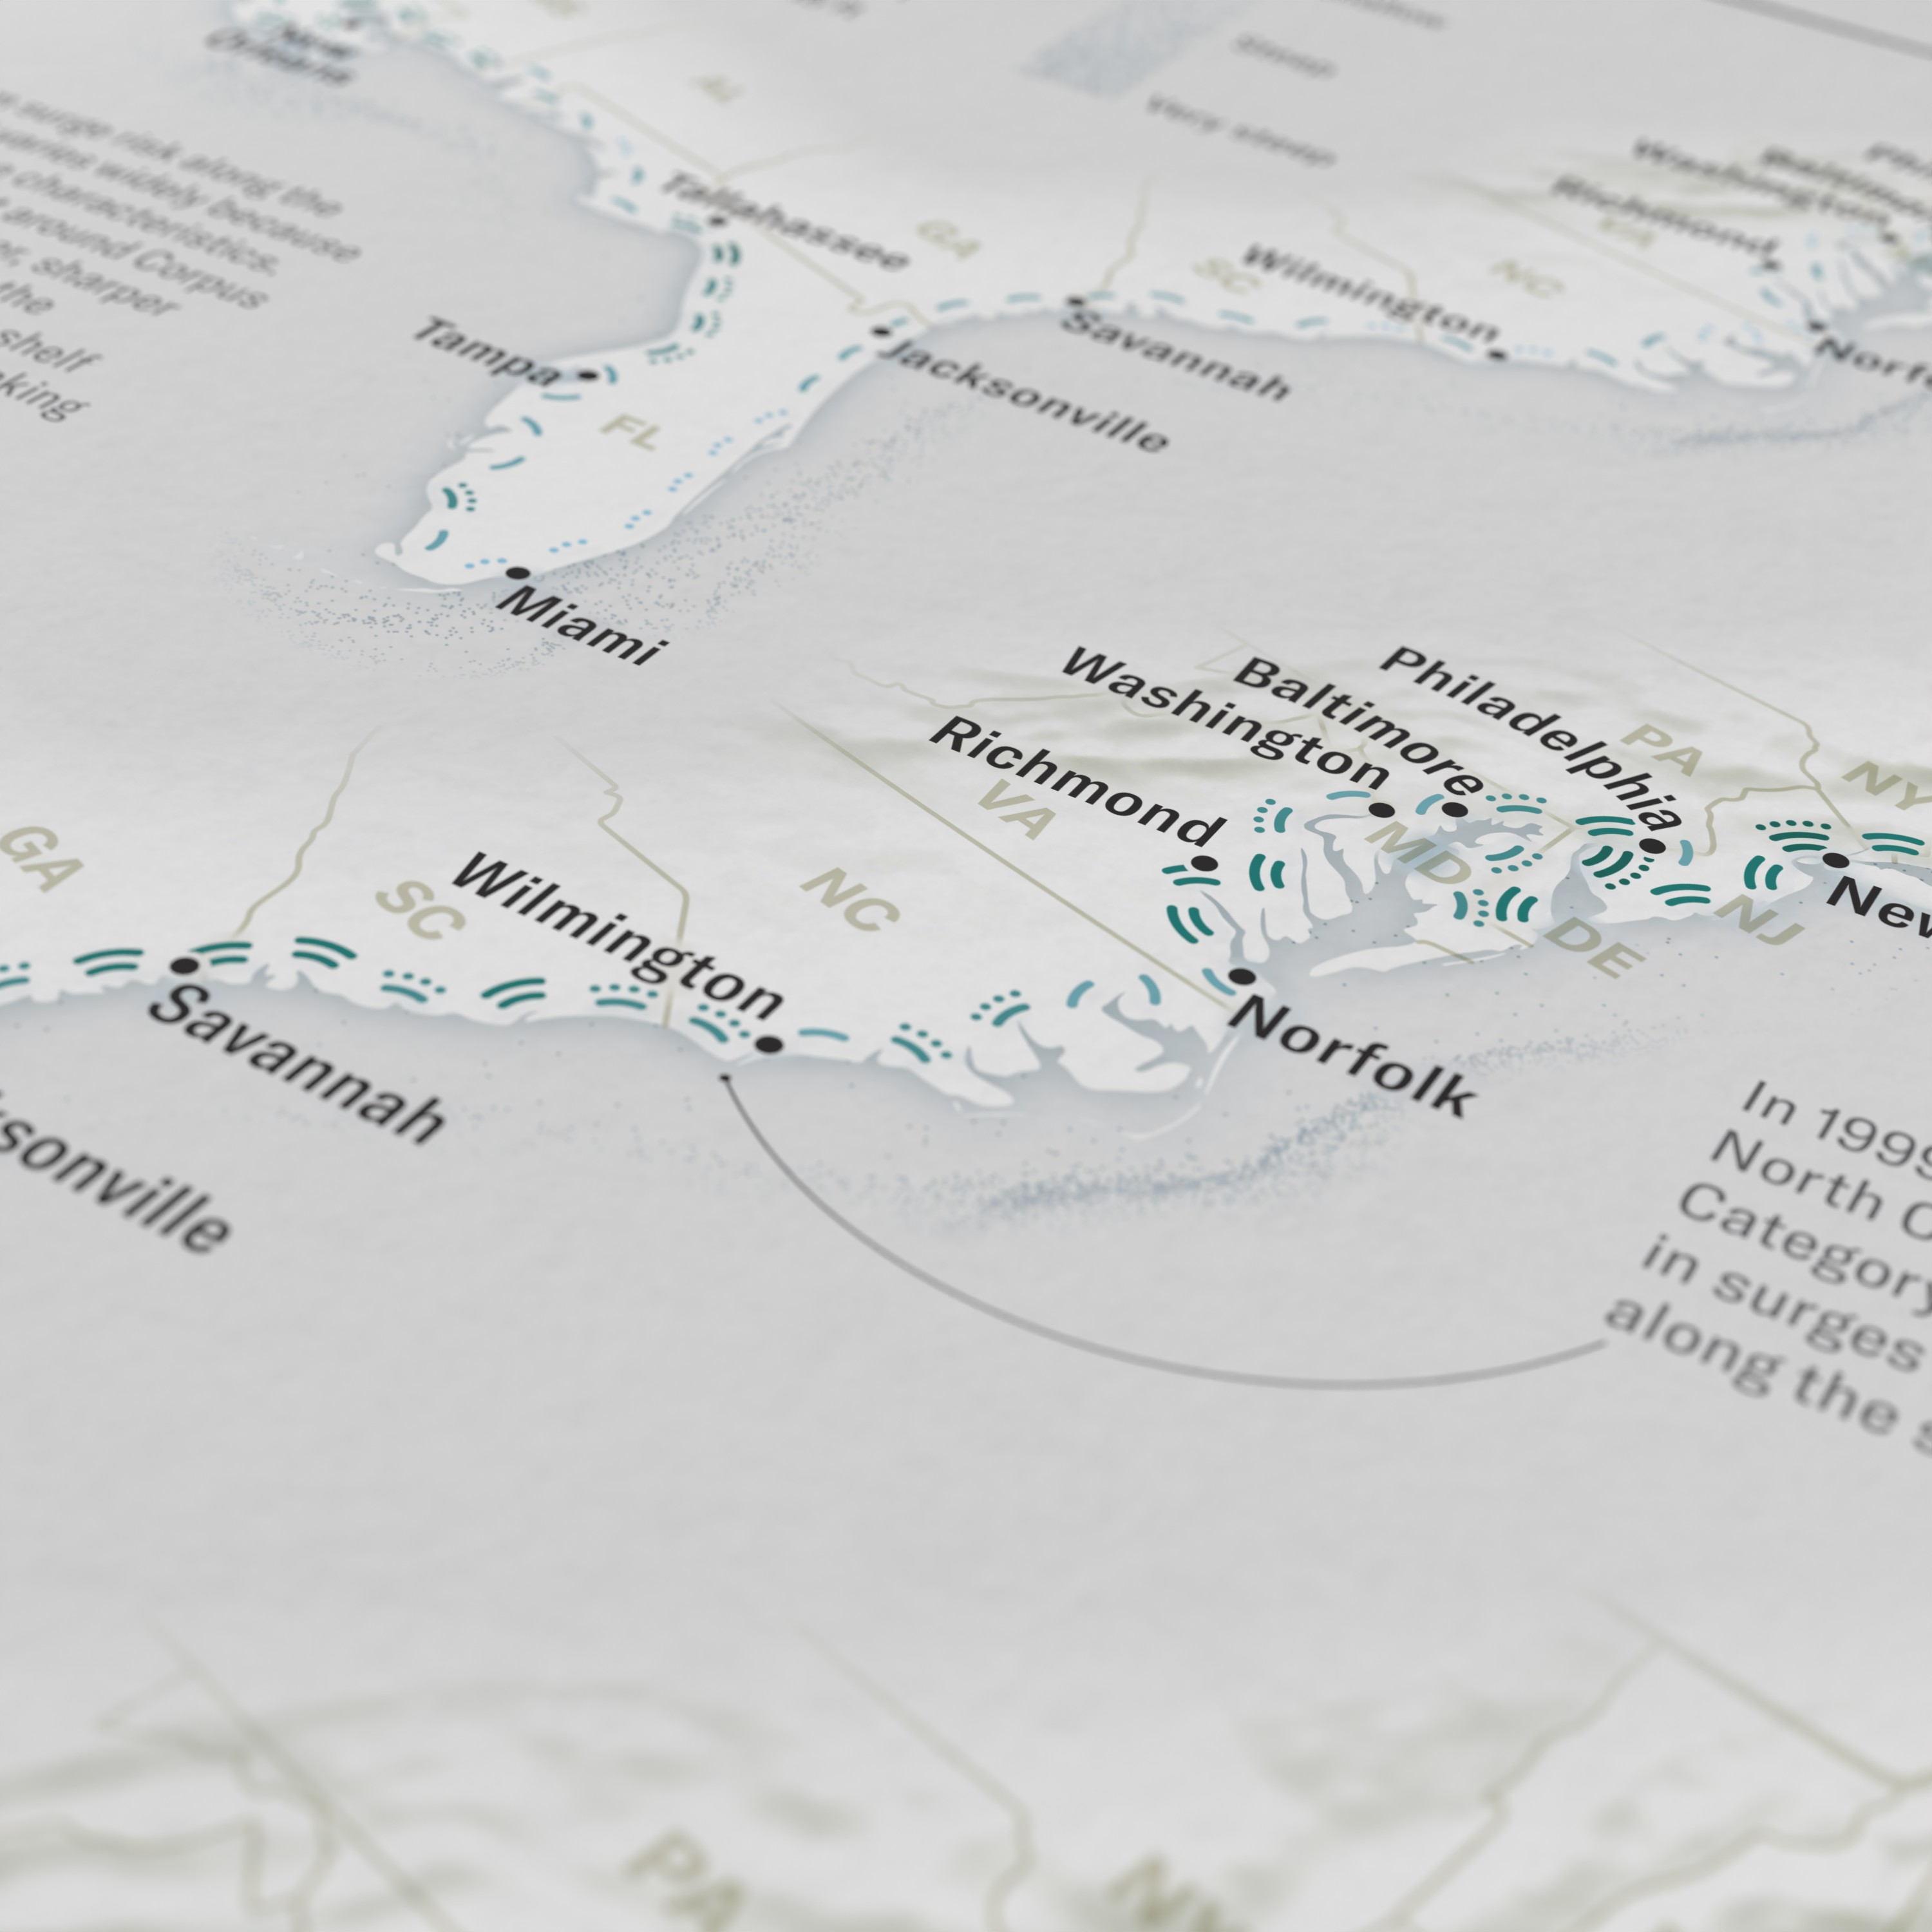
April 2025This was a fun one. I got to tackle a huge dataset on storm surge predictions for the US east coast. This dataset of surge heights was tens of thousands of pixels on a side, far too detailed to print, and far too detailed for a reader to see the pattern easily. So I heavily smoothed it, looking for the median surge level in each region. I represented this through symbols that vary in color and in shape (number of waves) to make it easy to discern the overall trend.
Aligning the symbols properly was an interesting challenge. There are only a few dozen, so I could have done it manually, but instead I sampled the azimuth of my coastline, did some smoothing of the values, and used that.
Click here to have a look at the story!